You can perform impact analysis on tables and columns, and analyze their impact as source and target.
This topic walks you through the steps to view impact analysis of tables. Similarly, you can view impact of systems, environments and columns.
A table can be a source, target, or both in a mapping specification. It can also be used for transformations, such as business rules and lookups in a mapping project. Impact analysis helps you identify these impacts of the table on mapping projects.
To run impact analysis at table level, follow these steps:
- Go to Application Menu > Data Catalog > Metadata Manager > Explore.
- On the Explore tab, click an environment tile to see its details.
- In the Data Catalog pane, click a table.
- Click the Impact Analysis tab.
Impact analysis of the table appears.
It displays the asset hierarchy, sensitivity data indicator (SDI) classification, data quality analysis, and table's impact based on related assets in your metadata.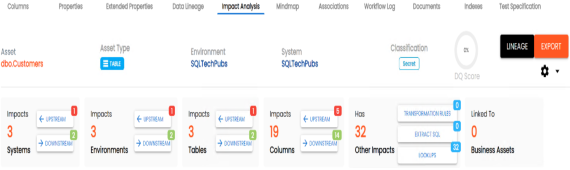
Alternatively, click to switch the Overview Impact option ON to exclude non-existent systems and environments from the impact analysis. When this option is switched off, the view includes systems and environments that do not exist in the Metadata Manager.
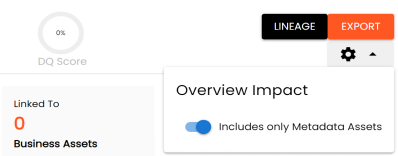
- On the Tables card, click Upstream.
The upstream dependencies of the environment appear in a grid format.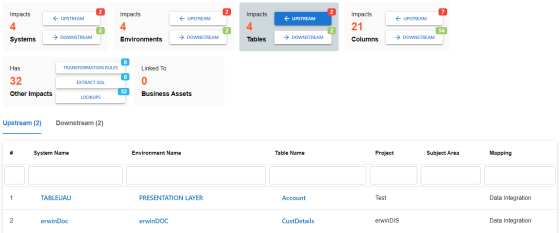
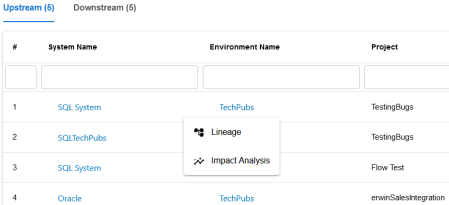
Similarly, you can view downstream dependencies on the Downstream tab. - On the Upstream or Downstream tab, click an asset to view its lineage or impact analysis. For more information on running lineage analysis on assets, refer to the Running Lineage Analysis topic.
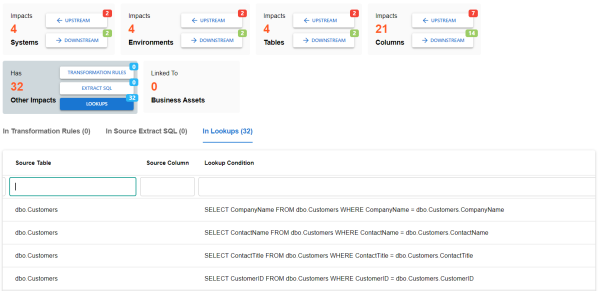
Use the Other Impacts tile, and click one of the following to view them:
- Business rules
- Source Extract SQL
- Lookups
For example, the image below displays the In Lookups tab with lookup conditions that impacts the asset type. Also, you can switch between In Source Extract SQL and In Business Rules tabs to view relevant impacts.
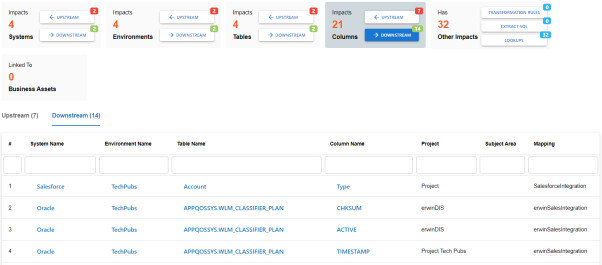
You can also view the upstream and downstream dependencies of other impacted assets from selected tablet's perspective. For example, the image below displays upstream column dependencies from the table's perspective.
Additionally, use the following options:
Use this option to view lineage based on the asset type.
Use this option to export the impact analysis in the XLSX format.
|
Copyright © 2026 Quest Software Inc. |